Pre-Investment Considerations: Introduction to Unit Impact and Volume Curves
“Our technology could reduce CO2 emissions by 1 MT.”
“Total CO2 Saved: 1,000,000 tons.”
How would you interpret these two statements?
Two years ago, statements like this were becoming increasingly common in public reports among investors, portfolio companies, LPs, and others across the investment spectrum. But underneath these statements are a variety of unstated assumptions, such as:
Is the impact cumulative or per year?
Do they include operations or recycling?
What are those emissions compared against?
Project Frame, which was founded to improve and increase transparency around emissions impact assessment methodology standards, released its first draft of guidance to address these topics in April 2023: Pre-Investment Considerations: Diving Deeper into Assessing Future Greenhouse Gas Impact.
At its February 2024 Community Meeting, founding Frame Content Working Group members Rick Cutright, Technology Director at Climate Investments (CI), and Morgan Sheil, previously a Fellow with Project Frame, provided an introductory class on assessing emission impact.
This session was a beta version of a 101 curriculum that restructures Frame’s pre-investment guidance into an education tool for earlier-stage impact analysts.
We want your feedback!
Watch the recording of our introduction to unit impact and volume curves session and complete our feedback survey to receive early access to our new Effects Table tool, developed by Climate Investments (CI) for the Project Frame community.
The Basic Calculation Behind Impact
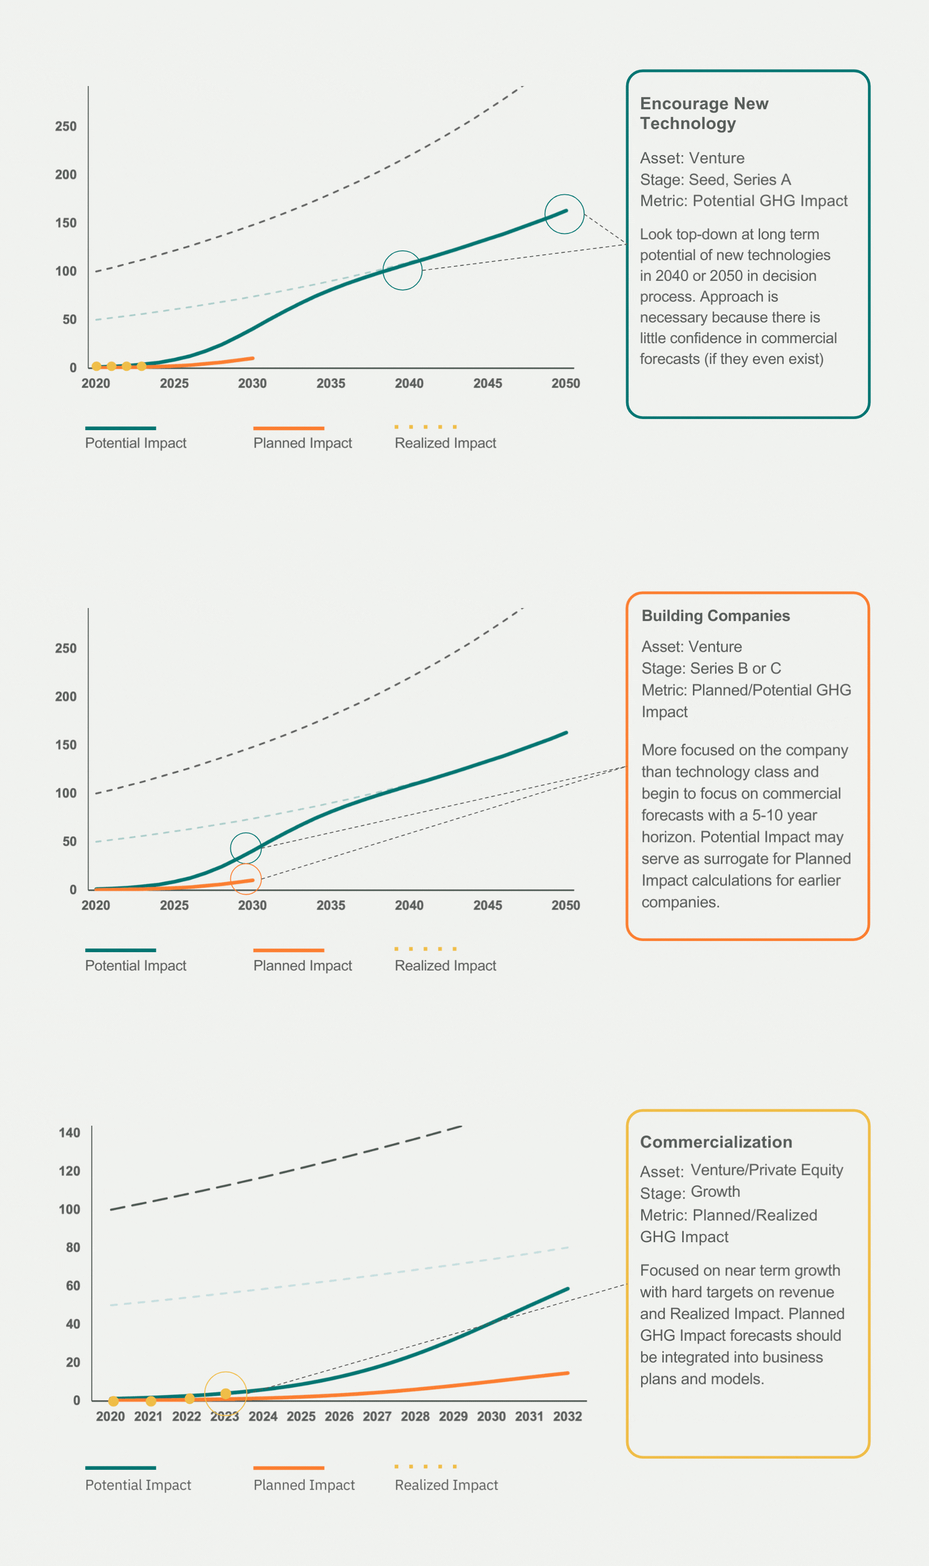
Project Frame’s methodology is centered around three ways of considering forward-looking impact—Potential Impact, Planned Impact, and Realized Impact—and where and why investors might use these different methodologies.
In the basic calculation, investors multiply unit impact by volume to quantify GHG impact. Unit impact is the difference in emissions between a single unit of the climate solution you're assessing and a comparable incumbent unit. The difference between potential, planned, and realized impact lies in how you quantify volumes.
“It's important not just to say, ‘We're going to be assessing potential impact or planned impact or realized impact,’” said Sheil. “You have to make sure that the type of impact you're modeling aligns with how you approach the investment stages that you focus on and your strategy.”
For example, using the top-down approach of potential impact could make sense for venture firms investing in seed to series A stages for new technologies, as they will be looking forward to decades into the future, whereas a firm investing in series B or C might take the bottoms-up approach of planned impact to look at the next five to ten years more closely.
Introduction to Unit Impact
No matter how effective a climate solution is, there will always be emission associated with it.
When looking at the unit impact of a solution, investors are “trying to quantify those emissions and then comparing that to the incumbent [or status quo unit that] is being replaced with the climate solution,” explained Sheil.
“That impact is going to vary from solution to solution, and it's going to vary based on how you select the incumbent,” she said.
An investor's decision on which incumbent(s) to use will depend on its own market philosophy, the type of assessment it is completing, and more. For example, Cutright explained, comparing electric vehicles (EVs) to internal combustion engines (ICE), as opposed to a bicycle, will yield very different final impact numbers. As would taking into account location-specific emissions factors.
Equally important, Cutright explained, is understanding how the parameters that affect both the solution and the incumbent can change over time, thus changing the unit impact.
“Assuming that the incumbent is not going to get any better over time typically is not the best practice,” he said, continuing with the example of EVs and ICE vehicles. “When you look at the data, they continue to get a little bit better year over year. Even if we didn't have EVs, [the incumbent] probably would [continue to] improve.”
Given the number of parameters that can impact emissions—ranging from the embodied emission associated with the raw materials to those attached to energy usage or external influences, such as grid carbon intensity—it’s important to zero in on those that will be the most significant, Sheil pointed out: “The aim with this work is to identify the fewest significant drivers of emissions that you can for your impact analysis.”
To assist with zeroing-in on the most significant drivers of emissions, Cutright and Climate Investments (CI) has created a Project Frame Effects Table template, available with early access to those who complete Frame’s Methodology 101 Feedback Survey.
Introduction to Volumes Curve
The volumes by which you have to multiply the unit impact depend on the information you have available to scope the Total Addressable Market (TAM), Serviceable Addressable Market (SAM), Serviceable Obtainable Market (SOM), and sales forecast derived from the company’s commercial business plan.
“This really highlights how integral every step of diligence in a company is to looking at what the impact [could be],” said Cutright.
Within Frame’s methodology, the SOM of a solution typically aligns with the volume needed to quantify potential impact while the detailed sales forecast will align with the volume needed to quantify planned impact.
“You have to be really clear in communicating which market scope you're using and make sure that's consistent across both the impact model and the financial model that the deal teams are using,” said Sheil. For example, how does the cost of the solution or ease of installation factor into market adoption?
That is where the SAM and SOM play a role, explained Cutright.
In the case of an online marketplace for climate solutions, for example, while it might not have any direct impact in and of itself, it facilitates impact by accelerating a climate solution’s adoption, growing the SAM.
Alternatively, a climate solution that could be installed without the assistance of a contractor can accelerate the SOM adoption rate and increase market penetration.
Due to the complicated nature of these calculations, however, Sheil emphasized the importance of transparency in your modeling.
“You don't want to overestimate or try to capture the largest number,” she said. “You want to be realistic because it's important to invest into facilitating solutions, but you don't want to overestimate the impact it’s going to have or invest in something that is so indirect, it is unlikely to have a real effect.”
Share your thoughts!
Watch the recording of our introduction to unit impact and volume curves session and complete our feedback survey to receive early access to our new Effects Table tool, developed by Climate Investments (CI) for the Project Frame community.


